Why this paper exists
We publish the calibration results of our predictive model against real-world advertising performance. Honest error bars. Transparent methodology. We show where the model works, where it fails, and what we do not yet know. This is a methodological piece, not a marketing piece. Other labs should be able to replicate the approach on public data.
The category does not have a calibration norm. Simile is gated. Neurons Inc and System1 publish selected case studies. Aaru and Listen Labs make aggregate claims in press. A proper calibration study, even at pilot scale, is more than most of the field has published (see why we publish).
Until calibration is routine, the field's claims about accuracy should be read skeptically, including ours.
What we predicted
We score creative on four signal families (see the four signals framework).
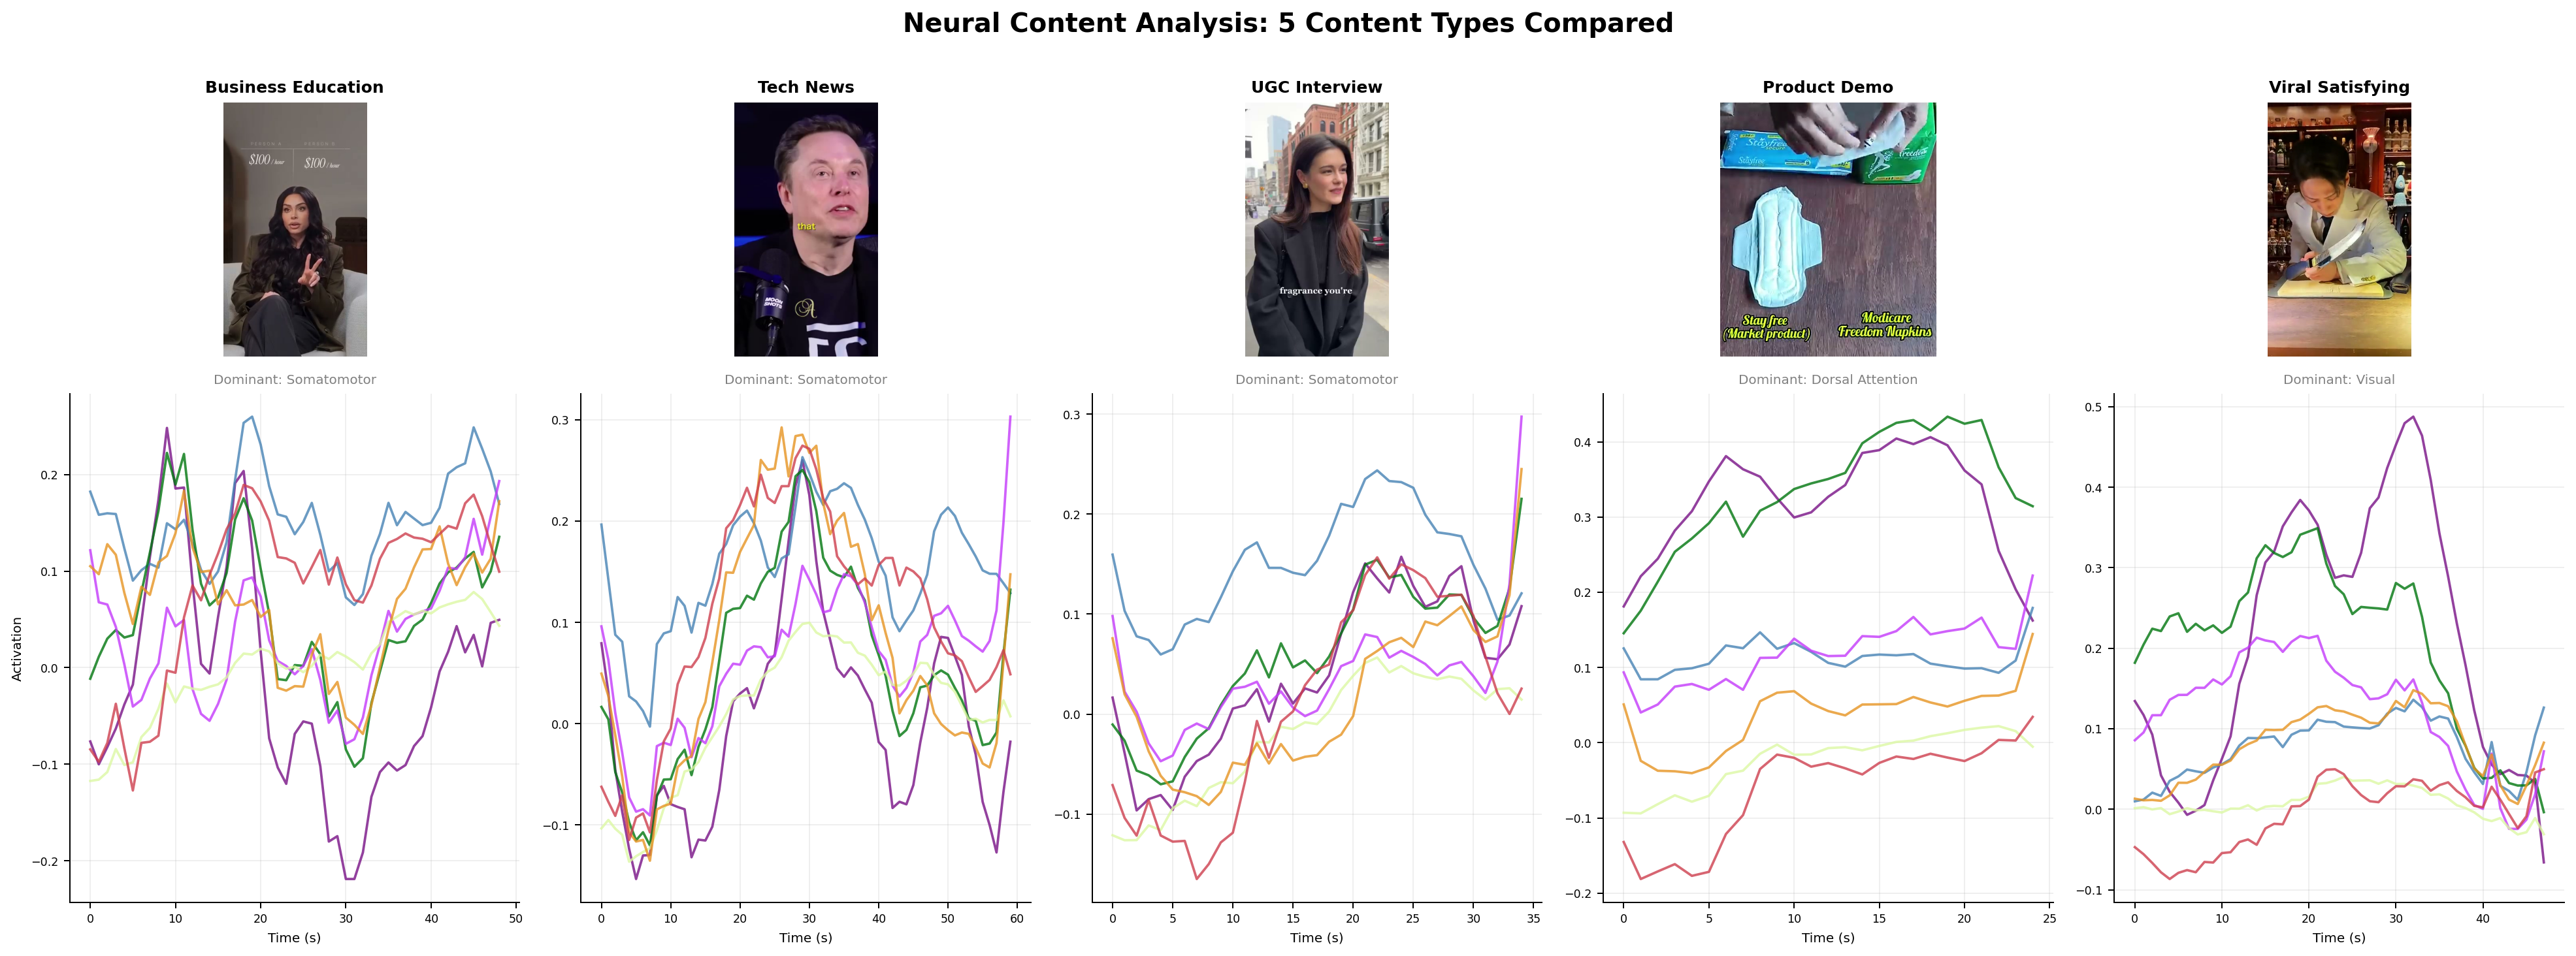
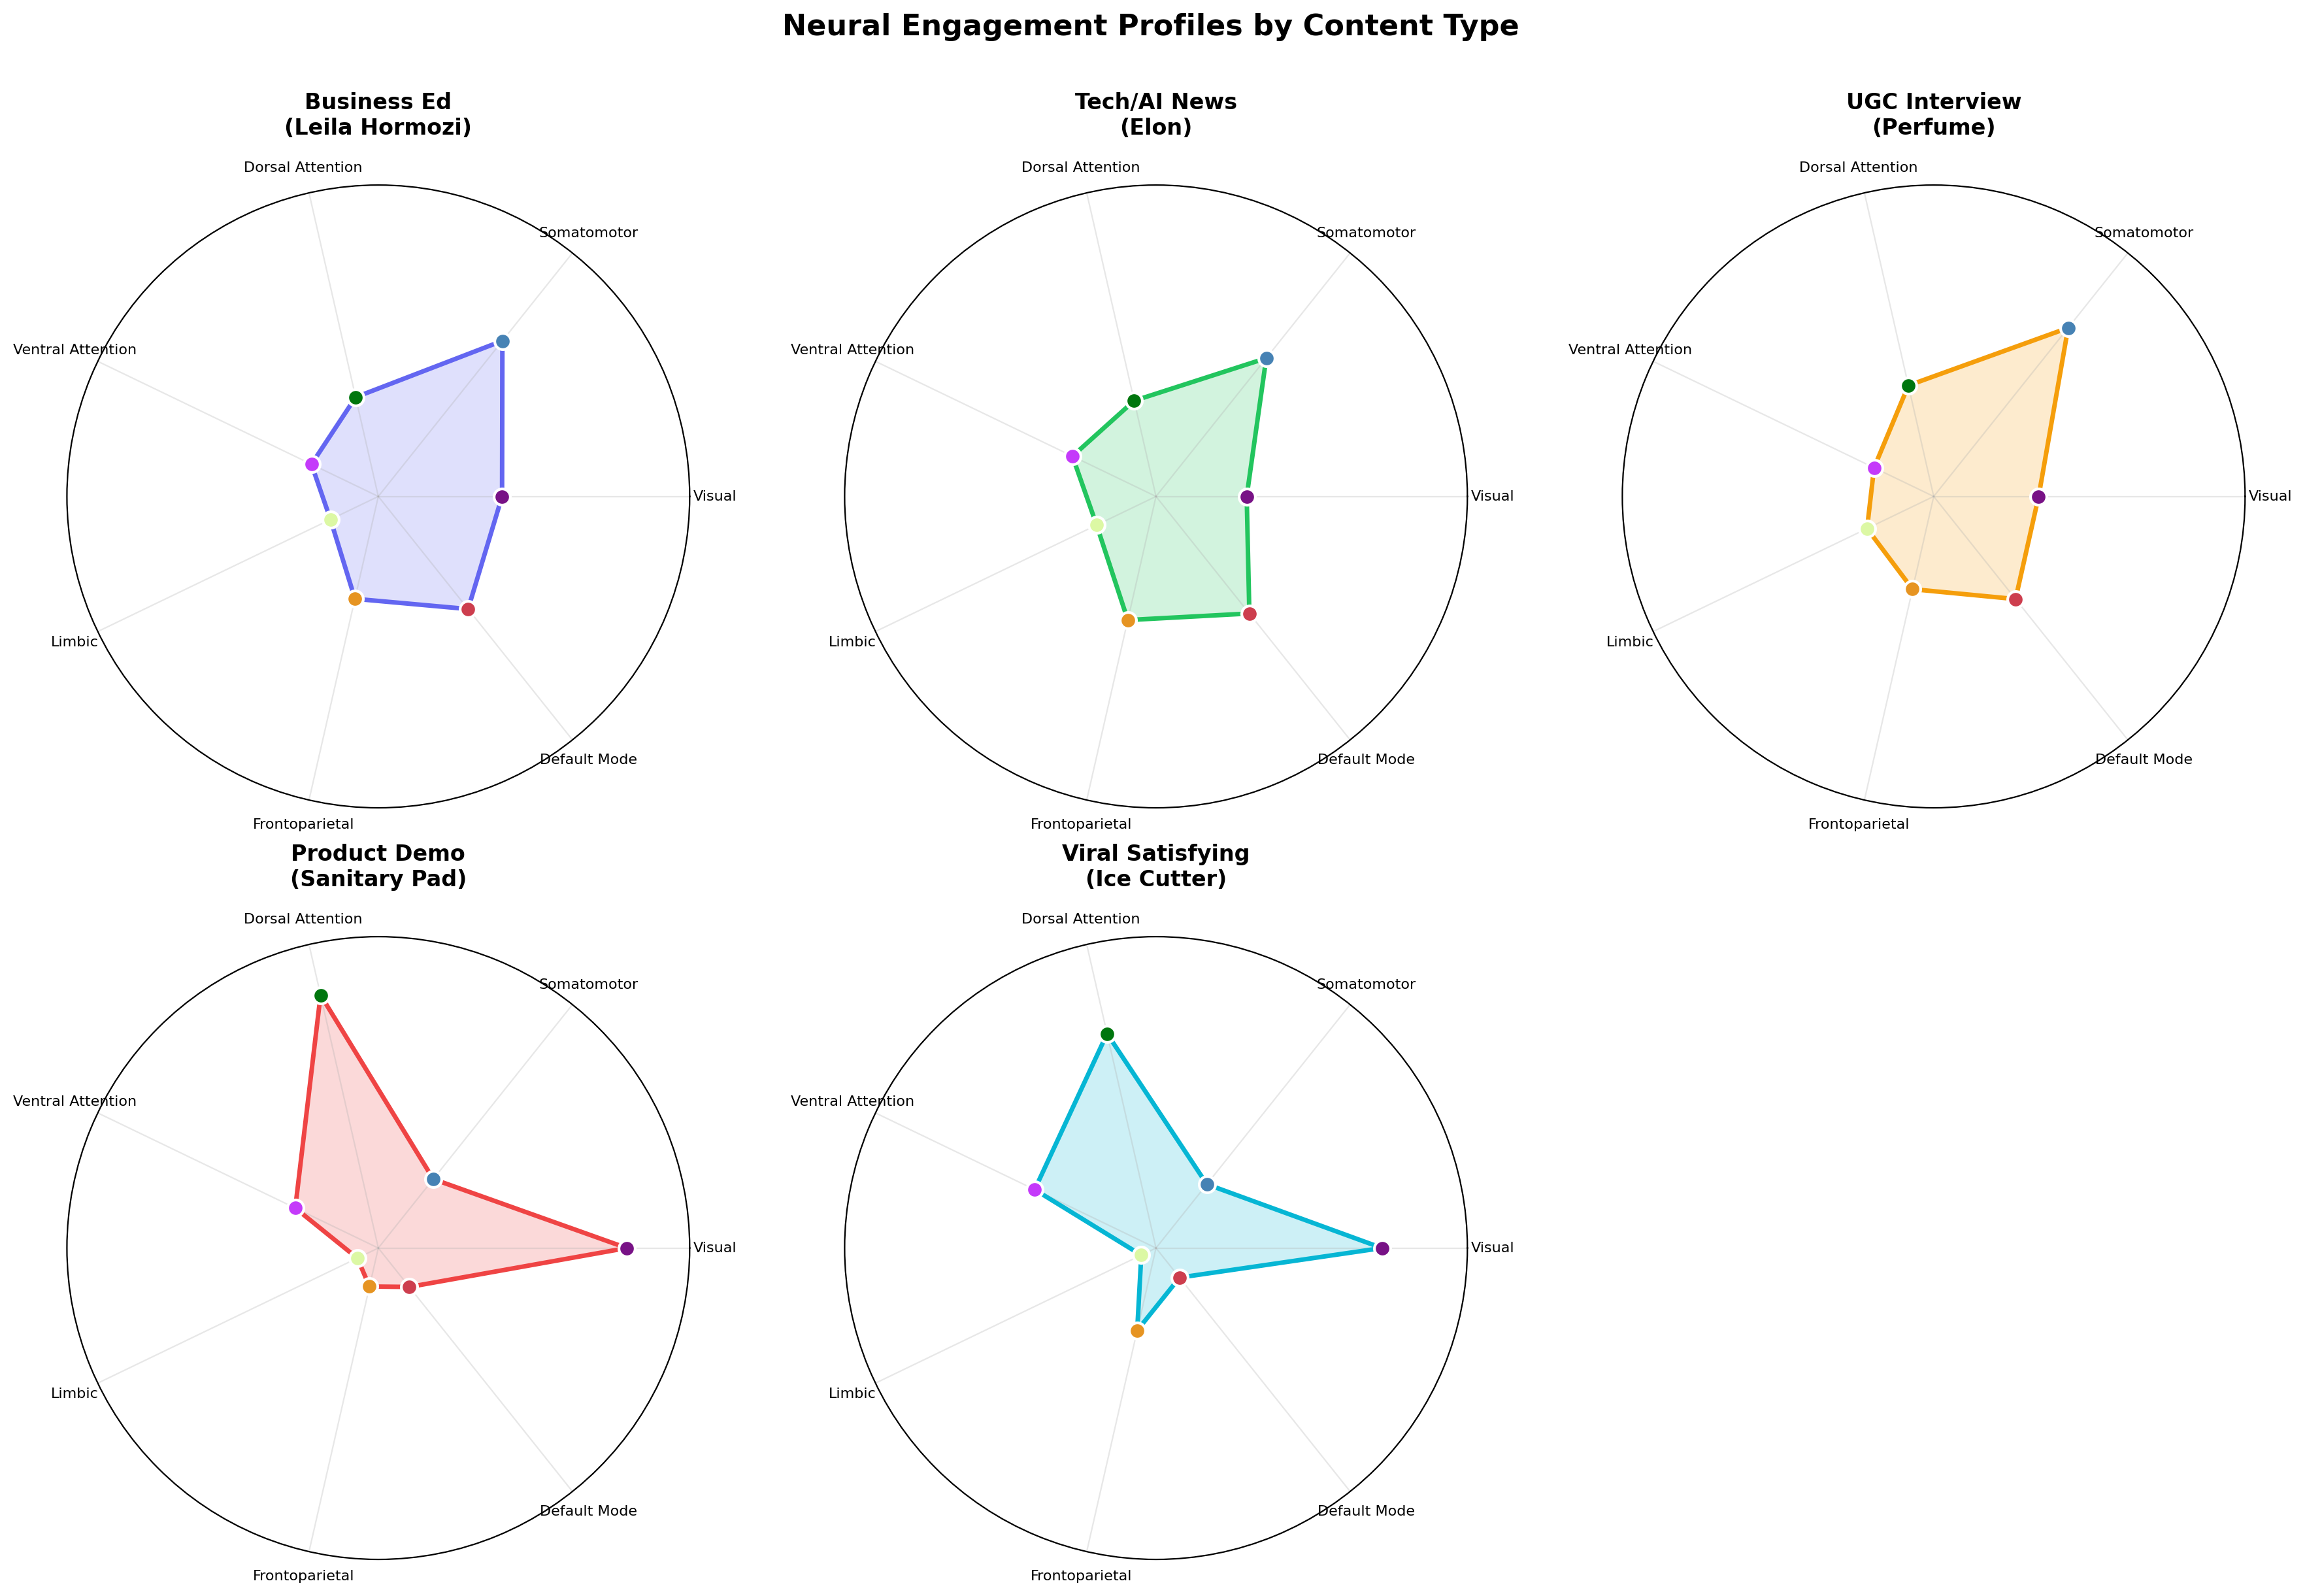
- Neural. Forward cortical response prediction, built on TRIBE v2 and MindEye-class encoders (see the encoding models review).
- Linguistic and affective. Psycholinguistic features, emotional arc, arousal-valence mapping, persuasion-marker density.
- Cultural. Live zeitgeist proximity from Google Trends, platform-specific virality data, and language drift detection.
- Historical. Nearest-neighbor matching against Meta Ad Library archives, creative intelligence taxonomies, and paid social benchmarks.
The composite is a hybrid-fused model: cross-attention layers combine the four family embeddings and output a predicted outcome distribution, not a point estimate.
Ground truth
Public Meta Ad Library data (see the Meta Ad Library guide). Selection criteria: ads in DTC categories (beauty, apparel, finance, health) with spend-range and impression-range data, active within a fixed quarter, English-language US audience. Spend ranges normalized to midpoint for regression; robustness checks conducted on band endpoints as well.
Pilot study: 842 ads across 41 advertisers, April to June 2025 creative window. Outcome measure: impression share within category, log-transformed. This is a proxy for reach-weighted performance, not sales. Limitations of the proxy are addressed in the Limitations section.
Methods
Preregistered analysis plan (OSF link will be posted on completion of the registered analysis). Cross-validation design: 5-fold with advertiser-level held-out splits, so the model never predicts outcomes for an advertiser seen in training.
Feature extraction runs per-modality encoders on each ad. The fused model is trained on a separate earlier time window to avoid temporal leakage. Significance testing uses bootstrapped 95 percent confidence intervals on Spearman correlations; we also report Pearson and Kendall for robustness.
Companion methods references: Plassmann, Venkatraman, Huettel, and Yoon's 2015 JMR piece[1] set out the methodological standards this study tries to meet (preregistration, cross-validation, held-out benchmarks).
Results (preliminary pilot)
Preliminary numbers, to be replaced by preregistered estimates when available:
- Composite model Spearman correlation with log-impression-share: r ≈ 0.54, bootstrapped 95 percent CI [0.46, 0.61].
- Neural-only baseline: r ≈ 0.31, CI [0.22, 0.39]. Linguistic-only: r ≈ 0.28, CI [0.19, 0.37]. Cultural-only: r ≈ 0.24, CI [0.15, 0.33]. Historical-only: r ≈ 0.39, CI [0.30, 0.47].
- Incremental variance explained by each family above the other three: neural +0.08, linguistic +0.05, cultural +0.07, historical +0.09. Each family contributes; none is dominant.
These numbers are in the same range as the published literature[2][3]. They are not outside it. They are not magic.
Subgroup analyses (industry, ad format, region) show the model works best in DTC beauty and apparel and degrades in B2B and finance, which is consistent with training-data density. Those numbers will be in the methods supplement.
Failure modes we can already name
- Out-of-distribution creative. Formats we did not train on (interactive CTV, novel TikTok conventions post-cutoff) degrade predictably.
- Novel cultural moments. The cultural signal family is the hardest to keep fresh. Our weekly retrain is the practical mitigation, but it is not a full solution.
- Short-form vertical video. Currently under-represented in training; confidence intervals widen on this slice.
- B2B creative. The Ad Library corpus skews consumer. B2B predictions have noticeably worse calibration.
- Non-English creative. Zero-shot transfer works but with degraded accuracy. Not a substitute for per-language calibration.
Comparison to prior literature
The seminal forward-prediction studies (see neuroforecasting) put effect sizes in the following ranges:
- Venkatraman et al. JMR 2015[2]: ventral striatum fMRI adds incremental R² 0.10 to 0.14 over traditional measures on market-level sales (n=30 TV ads).
- Boksem and Smidts JMR 2015[4]: r 0.5 to 0.7 for frontal beta and gamma EEG predicting movie-trailer box office (n=32 subjects, 18 trailers).
- Barnett and Cerf JCR 2017[5]: EEG ISC predicts opening-weekend box office at r 0.74 to 0.88.
- Dmochowski et al. Nat Comms 2014[6]: EEG ISC predicts Nielsen ratings at r 0.6 to 0.7, Twitter chatter at r 0.5 (n=12-16).
- Scholz et al. PNAS 2017[7]: mPFC plus value-system predicts NYT article virality.
- Genevsky, Yoon, Knutson J Neurosci 2017[8]: NAcc predicts Kickstarter funding.
Our composite pilot (r ≈ 0.54 on impression share) sits in the middle of this range. We do not claim our numbers exceed the strongest reported academic effects. We claim that ours are reproducible on public data with a preregistered analysis.
Limitations
Meta Ad Library returns ranges, not exact spend or impressions (see Ad Library guide). Midpoint estimation adds noise. Class of advertiser matters; selection into the Library is not random. Impressions are not the same as sales. The outcome proxy is one link away from the thing a buyer cares about.
We report impression-share correlation, not sales correlation, because sales data is private. Sales-linked calibration is a separate study with a smaller sample and a collaborator agreement; status of that work will be announced when it has cleared IRB and data-sharing review.
What we publish next
- Full preregistered analysis and data repository on OSF and GitHub.
- Quarterly calibration updates with expanded category coverage.
- A sales-linked calibration with partner advertisers (IRB pending).
- An external replication invitation; we want other labs to reproduce the approach on independent inputs.
- A methods supplement covering the fused-model architecture and training regime.
How to read this result
A moderate-effect, directional forecast with honest uncertainty. Not magic. Not noise. Useful as one input in a content decision, especially when paired with human qualitative insight and the other three signal families (see the four signals).
If you are a vendor reading this and wondering why you would publish your own calibration given how modest our numbers are: because the alternative is the last twenty years of neuromarketing (see neuromarketing in 2026). The category gets better when more of it operates in public.
References
- 1Plassmann, Venkatraman, Huettel, Yoon. Consumer neuroscience: applications, challenges, potential solutions. JMR 2015.
- 2Venkatraman et al. Predicting advertising success beyond traditional measures. JMR 2015.
- 3Karmarkar and Plassmann. Consumer neuroscience: past, present, future. Organizational Research Methods 2019.
- 4Boksem and Smidts. Brain responses to movie trailers predict individual preference and population box office. JMR 2015.
- 5Barnett and Cerf. A ticket for your thoughts. J Consumer Research 2017.
- 6Dmochowski et al. Audience preferences are predicted by temporal reliability of neural processing. Nat Comms 2014.
- 7Scholz et al. A neural model of valuation and information virality. PNAS 2017.
- 8Genevsky, Yoon, Knutson. When brain beats behavior. J Neurosci 2017.
- 9Falk, Berkman, Lieberman. From neural responses to population behavior. Psych Science 2012.
- 10Ariely and Berns. Neuromarketing: hope and hype of neuroimaging in business. Nat Rev Neurosci 2010.